This week was the first time that I had the chance to create a diagram using SVGs. I’ve dabbled a bit with Inkscape in the past for creating some icons and the sweet graphic illustrated below that I put on a t-shirt for my parent’s Christmas presents.
But this was the first time that I got to use it for the web. Most of the markup was familiar since it is similar to standard HTML tags and you can use CSS to style and animate it. Making basic shapes like circles and rectangles were pretty straightforward too.
The hard part came when I needed to draw a path. Specifically, I wanted to create a curved rectangle with text inside of it. So I spent a lot of time on MDN reading about paths. At first they look a bit intimidating. You just see a long string of letters and numbers that clearly mean something to the computer but might as well be Greek to you. Bellow is an example.
<path d="M 80 80 A 45 45, 0, 1, 1, 125 125 L 125 80 Z" fill="blue"/>So the first thing to note is that the letters represent the beginning of a command. The numbers that follow the letters are parameters for that command. The commands are executed from left to right. As they execute they draw a line. So the order of the commands matters.
The casing of the letters is also important. If they are upper-case then any coordinates in the command parameters are taken as absolute positions. If the are lower-case then the coordinates are relative to the final position of the last command.
At first it is a bit confusing how you should use white-space and commas. The white-space between a command and its first parameter is optional. The commas are also optional but you must at least have a comma or a space to delimit the command parameters.
There are more commands than those in the above example but they are all I needed for my task so I will focus on them for now. Also I’m going to be using the upper-case versions. Here are what they mean:
- M x y
The ‘M’ stands for ‘Move To’. It sets the starting point (x/y) for the next command. - A rx ry x-axis-rotation large-arc-flag sweep-flag x y
The ‘A’ stands for ‘Arc’. This command draws an arc based on an ellipsis. Most of the command deals with constructing and orienting an ellipsis but the only portion of it that will be rendered is the arc. The rx and ry set the radius for the ellipsis along the x and y axis respectively. The x-axis-rotation rotates the ellipsis on the x-axis. The large-arc-flag and sweep-flag are black magic and you should go read the MDN article for a more thorough introduction. The x and y at the end indicate the coordinates for the end of the arc. - L x y
The ‘L’ stands for ‘Line’. This command draws a line from the end of the previous command to the x/y coordinate that you specify. - Z
The ‘Z’ stands for ‘Close Path’… I guess because Z is the end of the alphabet and C was already taken for ‘Cubic Beizer’. You don’t have to end your path with a Z. You can leave it open if you like. But if you do add a Z then it will draw a line from wherever the last command left off back to where the first command started so that you end up with a closed path.
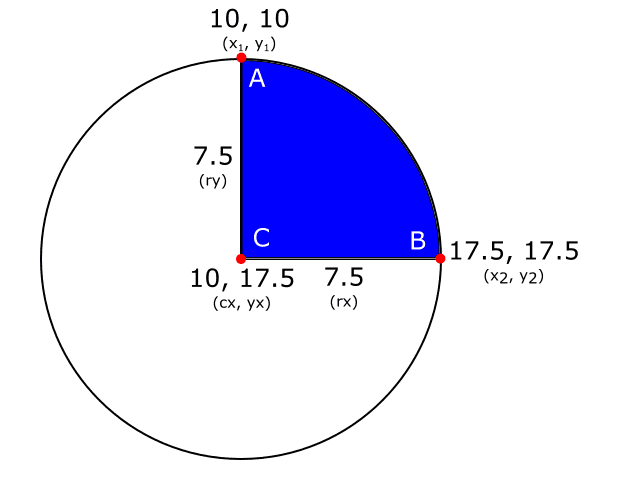
What helped me grasp how arcs are drawn was to draw each part of the commands out. So here is an example command and its illustration.
<path d="M 10 10 A 7.5 7.5 0 0 1 17.5 17.5 L 10 17.5 Z" fill="blue"/>For reference 0, 0 is in the upper left corner and angles are calculated relative to 3o’ clock. So M 10 10 moves over 10 and down 10 to point A. The arc command moves from point A to B along the curve of the circle. The rx, ry define the radius of the circle (7.5). The x-axis-rotation is left at 0 so there is no rotation. The large-arc-flag is set to 0 and the sweep-flag is set to 1 so the arc moves at a positive angle (clock-wise) around the circle. The x, y coordinates tell it where to stop (17.5, 17.5). Then the line command draws a line from B to C (10, 17.5). Finally the Z command draws a line from C back to A which is our starting point.
This was a simple example using a 90 degree angle that formed a triangle aligning with the x and y axis. So the math to determine the points is easy. If you were to rotate the arc or change the angle then you have to pull out the ol’ TI-89 and do some trig.
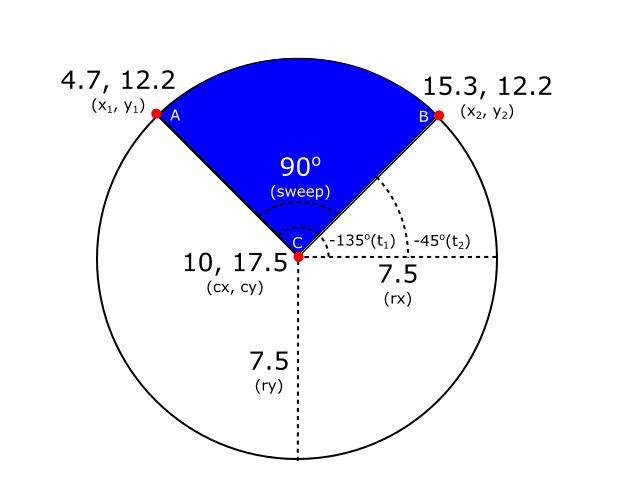
For the problem I was solving I wanted a 90 degree angle going from -135 deg clockwise to -45 deg. To find the x/y coordinates of the arc we need to use the parametric equation for an ellipse. For my use-case, and for simplicity, we will assume that the ellipse is not tilted. The following are the formulas, the diagram that illustrates them, and the resultant path.
x1 = cx + (rx * cos(t1));
y1 = cy + (ry * sin(t1));
x2 = cx + (rx * cos(t2));
y2 = cy + (ry * sin(t2));<path d="M 4.7 12.2 A 7.5 7.5 0 0 1 15.3 12.2 L 10 17.5 Z" fill="blue"/>Personally I don’t like hard-coding values like this. For one thing, I don’t like recalculating this for every new path or whenever I change something variable. Also I feel that it hides the relationships between the objects. So below is some JS code to calculate the path.
function calculateArcPath(cx, cy, rx, ry, startAngle, sweepAngle) {
  // no arc for you
  if (sweepAngle === 0) {
    return `M${cx} ${cy}`;
  }

  // normalize the angles to be within a circle
  startAngle %= 360;
  sweepAngle %= 360;

  // i.e. sweepAngle was a multiple of 360
  if (sweepAngle === 0) {
    // create two half circles to cover the full circle
    return `
      M ${cx + rx} ${cy}
      A ${rx} ${ry} 0 1 1 ${cx - rx} ${cy}
      A ${rx} ${ry} 0 1 1 ${cx + rx} ${cy}
      Z`;
  }

  // stay positive for simplicity
  if (sweepAngle < 0) {
    sweepAngle += 360;
  }

  const largeArc = sweepAngle > 180 ? 1 : 0;

  // convert degrees to radians
  const t1 = startAngle * Math.PI / 180;
  const t2 = (startAngle + sweepAngle) * Math.PI / 180;

  // calculate the coordinates (doesn't handle x-axis-rotation)
  const x1 = cx + rx * Math.cos(t1);
  const y1 = cy + ry * Math.sin(t1);
  const x2 = cx + rx * Math.cos(t2);
  const y2 = cy + ry * Math.sin(t2);

  return `
    M ${x1} ${y1}
    A ${rx} ${ry} 0 ${largeArc} 1 ${x2} ${y2}
    L ${cx} ${cy}
    Z`;
}
So there you have it! I found that there is a steep learning curve to get into drawing SVGs but once you can visualize how the path is drawn then you can start drawing them fluently. Enjoy!
Erik Murphy
Erik is an agile software developer in Charlotte, NC. He enjoys working full-stack (CSS, JS, C#, SQL) as each layer presents new challenges. His experience involves a variety of applications ranging from developing brochure sites to high-performance streaming applications. He has worked in many domains including military, healthcare, finance, and energy.


